


The 16 dumbest things your MP has said about trade.
The truth about UK and EU trade


It is impossible to make a good decision with poor information. That is why, when most people have to make a decision on which their livelihood depends, they will spend time researching and then checking all of the available data. Unfortunately, the UK has a new crop of MPs who seem to believe they have no need to check any data beyond memorising the clickbait headline on the press release. (This knowledge has inspired my own clickbait headline.)
This was evidenced last Thursday at a Westminster Hall debate on the UK’s trading relationship with the EU. Westminster Hall debates do not directly impact legislation, nor do they have any legal power. This one seemed to be a session designed to influence the government's trade policy going forward. However, none of the MPs had researched the topic independently, and only one appeared capable of divergent thought. (Hat tip to Ben Colman, MP for Chelsea and Fulham, who strongly opposed tying EU fishing rights in UK waters with European defence negotiations.)
I sincerely hope that the 600-odd MPS who chose not to attend the Westminster Hall debate did so because they had done some independent research into UK EU trade or at least checked the false figures that were repeated by MPs throughout the debate, even by the Minister for Trade Policy and Economic Security who has a staff who should be able to check these statistics.
I will correct the misinformation, urban myths, and half-truths that were repeated during the debate one at a time.
1. ‘Deep alignment with the EU for goods and services could benefit UK GDP by 2%’
This is not a fact, it is a guesstimate, from a paper written by a group called Frontier Economics and paid for by the Rejoiner organisation, Best for Britain. The paper was written in February 2025, and it assumed that the UK and the EU would both have 20% tariffs applied to their exports by the US. The paper also only made guestimates about the change in UK exports if it aligned ‘deeply’ with the EU. The paper didn’t mention that such an alignment would also increase imports from the EU. In fact, the paper only mentions imports when discussing the US and does not mention UK imports from the EU. The paper, by the way, is completely wrong about UK-US trade, but I will deal with that in another article.
The Frontier paper defined ‘deep alignment’ as ‘mutual recognition’ and ‘a commitment to minimise regulatory divergence.’ In other words, dynamic alignment with EU regulations, but I imagine that the paper’s authors (or their funders) didn’t want to spell that out, and they hoped that the UK’s lazy MPS would not bother to read the fine print.
The many young MPs who happily quoted the Frontier paper seemed to be unaware that the UK was recently a full member of the EU and, despite total alignment, the UK’s largest export market for both goods and services was the United States of America, which is not a member of the EU. You don’t have to take my word for this, you can look this up in the ONS document: Trade in goods Country By commodity, exports, February 2025 and in the ONS document: Trade in services by service type and partner country. Strange that the MPS don’t know about these publicly available caches of trade information.
The US was the UK’s largest goods export market for total goods exports in 2018, 2019, 2020, 2021, 2022, 2023, and 2024. And UK goods exports to the US have grown by 12% since 2018. I am using 2018 as the Trade Minister stated that this was the last stable year before Brexit. It was also the UK’s highest pre-Brexit goods exports to the EU, but I am sure that this was not why the minister chose it as a base year. But the question remains, if deep alignment is so great, why didn’t it help UK goods and services exports when we were EU members?
Meanwhile, the US is not just the UK's largest service export market – 27% of the UK's total service exports go to the US, but UK service exports to the US have grown by 75% since 2018 and are almost five times larger than service exports to the largest EU country. This was Germany in 2024, which finally beat Ireland into third place.
How could ‘deep alignment’ with the EU in services be beneficial to the UK? Service trade is always largest between countries that use the same language, have similar tastes in music and films, have similar financial regulations, similar systems of common law, similar accounting systems and most importantly, have a similar attitude to ‘Anglo-Saxon Capitalism’. The EU strikes out on all of them except for Ireland, although UK service exports to Ireland are probably because of the many US companies based there for tax minimisation purposes, and so technically just additional exports to the US, but exported via Ireland. The Frontier paper didn’t calculate how much its guestimate of UK service exports would fall after Trump enacts his election promise and lowers US corporate taxes to 15%, equal to Ireland’s headline corporate rate.
But somehow, the Best for Britain/ Frontier Economics paper believes that deep alignment in goods and services would increase services exports to the EU27 by $8.8 billion. They don’t attempt to explain why such an increase didn’t happen when we were members and paid more than $8.8 billion to be members of the EU. It is also strange that they are using US dollars rather than British Pounds, were they trying to make this gain seem larger than it is? At today’s rate, $8.8 billion is only worth £6.6 billion. So it looks like yes, they were.
2. ‘Dynamic alignment with the EU will compensate for Trump's tariff increases’
The MPs in Westminster Hall were happy to quote the Frontier Economics paper when it promised increased exports, but they appear to have skipped over the part in the paper about the effect of increased US tariffs. Instead, they claimed that the UK needed to align with the EU to counterbalance the increased US tariffs.
The Frontier paper was written before the new US tariffs were announced. However, the US has now applied 25% tariffs to all UK-exported cars and many goods made with iron, steel or Aluminium. The US will only apply its minimum 10% tariff to other UK goods but will apply 20% tariffs on EU goods. These tariffs have been suspended for 90 days while the governments try to negotiate better terms with the US.
However, deep alignment with EU regulations will not encourage the US to lower the UK’s tariffs. In fact, the US Trade Representative’s (USTR’s) report on International Trade Barriers singled out the EU agricultural non-tariff barriers, such as its SPS rules, as one of the reasons for the higher 20% tariffs on EU imports. The USTR only gave the UK lower tariffs because, post-Brexit, the UK had approved Gene editing, and indicated that they would follow a risk-based approach to approving their regulatory policies.
Aligning with the EU’s unscientific SPS regulations and Maximum Residue Levels for agricultural chemicals would put the UK on the US high tariff list alongside the EU. As the US is by far the UK’s largest export market, that would be a devastating blow for UK exporters. Even when the UK was a member, the other EU countries didn’t buy enough UK goods to make up for the potential loss of UK exports to the US.
3. ‘UK agrifood exports could increase by 22% if the UK had a veterinary agreement with the EU’
Several MPs quoted this statement as fact, even though it is another (very poor) guesstimate from a paper written by a Chinese professor working at Aston Business School. This result is an absurdity because the authors of the paper did not put any upper bounds into their analysis. The Chinese authors also appear to have never looked at a map of agricultural land in the UK, read a Defra report, examined UK agricultural and environmental policies, nor noticed the UK’s cool climate. (Aston has produced another report lamenting the reduction in UK exports of HS14 (Bamboo and kapok) – I am not joking, read my review of the paper. These professors know nothing about UK agriculture, but the MPs who repeat this nonsense have zero common sense.
Even as a member of the EU, the UK did not export 22% more Agrifood goods to the EU. The UK couldn’t even increase its agricultural production by that amount because it has limited farmland, which is being further reduced by Defra’s generous environmental payments and the Energy Department’s equally generous subsidies for solar panels. Both have taken land out of agricultural production. The UK also has a growing immigrant population to feed. And UK agricultural goods are generally more expensive than those of other EU producers because we have higher wages, higher energy costs and more expensive land. Unlike in China, where they have multistorey piggeries housing over a million pigs that could pump up production pretty quickly, or even in the EU, where their largest piggery is in France and houses 250,000 sows, the UK has much more benevolent animal welfare rules which limit production as well as new post-Brexit regulations preventing live animal exports.
While the Chinese professors may be excused for not knowing this, surely the MPs representing rural constituencies should.
So, the UK’s ability to export more agrifood to the EU (or anywhere else) is unlikely to increase at all, let alone by 22%, regardless of whether they sign a veterinary agreement. All a veterinary agreement would do is reduce the costs of a small number of UK animal product exporters. The UK’s largest ‘agrifood’ export is whisky, and even the EU doesn’t require a veterinary agreement for whisky exports.
4. Trading with the EU was free (and paperwork free). Oh no, it wasn’t!
Many MPs at the Westminster Hall debate repeated information from various trade organisations and lobby groups without questioning the motivation of those organisations. Trade with the EU is not free, and it wasn’t when we were members either. Developed countries, like the UK, have to make compulsory ‘contributions’ to the EU budget. UK taxpayers were subsidising companies' trading costs with the EU. France for example, currently pays approximately E26 billion (£22 billion) per year for the privilege of “free” trade in the EU. Germany pays approximately E29 billion (£25 billion).
Of course, many companies are annoyed that they now have to pay their own costs when trading with the EU. For sure, they want to go back to a time when UK taxpayers paid for their trading costs instead, via our EU contributions. What company wouldn’t want this?
But surely these (Labour) MPs should smell a rat when these lobbyists come a-knockin'. It was mind boggling that so many of them repeated the complaints from an SME or a Haulier but never mentioned that the UK as a whole no longer has to pay £20 plus billion to the EU’s budget each year for this SME or that Haulier to have the privilege of having customs free trade with counterparts in the EU.
For the record, intra-EU trade isn’t ‘paperwork’ free. How strange that the lobbyists didn’t explain this to the MPs. EU-to-EU trade still requires an EORI number, VAT compliance, transport documentation, proof of origin documentation, commercial invoices, a release for free circulation, etc. You can look up the full details on the EU website here.
5. ‘The UK have been flooded with New Zealand lamb’
Although some of the MPs in Westminster Hall appeared to be very young, I would have expected them to know something about UK food imports before talking about it in a recorded Hansard session. But as they obviously don’t, here is a brief history lesson. When the UK joined the EEC, it brought with it a WTO quota for New Zealand lamb of 230,000 tonnes, which was technically shared across all of the EEC members. Most EEC/EU countries don’t eat much lamb, at least not outside the Northern Hemisphere lambing season. Consequently, the EU made the UK take 114,000 tonnes of this quota when they left, as the UK was the main consumer of New Zealand Lamb. Before 2016, the UK imported about 70,000 tonnes of New Zealand lamb each year, but in 2024 it imported only 40,000. So, there has not been a ‘flood’ of lamb, and it is not due to the UK-New Zealand trade deal. Under the WTO quota, UK buyers could have imported almost three times that amount of lamb from New Zealand, tariff-free. The new UK-New Zealand trade agreement limits additional New Zealand lamb exports for up to sixteen years.
However, if MPs are worried about competition for their sheep farmers, they should try to block cheaper lamb imports from Ireland and Spain. These countries have the same lambing season and are in direct competition with Welsh farmers, unlike southern hemisphere producers. Instead, these MPs want to get closer to the EU, increasing competition for their farming constituents.
I have some more bad news for these ignorant MPs—New Zealand now has a trade agreement with the EU as well. However, as the EU still has its 116,000 tonne share of the original WTO quota, it won’t need to import lamb from New Zealand under its new trade agreement.
6. ‘Seven years after Brexit, 52% of UK imports come from the EU’
Another talking point repeated by several MPS in the Westminster Hall debate was a statistic apparently from the Frontier paper that even ‘7 years after Brexit’, 42% of UK exports go to the EU and 52% of UK imports come from the EU. One would have expected these MPS, however young, to at least know that the UK didn’t leave the EU until January 31 2020. At best, this is only 5 years ago, not seven. Unfortunately, the UK has still retained most of the EU’s worst trade barriers against non-EU goods, especially for agricultural goods from non-EU countries. This is apparently in order to help the UK negotiate trade deals. But even under its new trade deals, the UK has been very slow to remove its trade barriers.
For example, the UK’s tariff on imported butter is £153 per 100 kg (or 38p per 250-gram block of butter). Butter imported from the EU comes in tariff and quota-free, but Australian and New Zealand butter is still subject to a £79 per 100 kg tariff and quotas of 8,500 tonnes and 11,000 tonnes, respectively. This is despite the UK importing over 63,000 tonnes of butter in 2024. This is why the UK is still predominantly trading with the EU, not because the EU is an efficient producer, nor because it is close, but simply because the UK is still actively making other countries’ imports more expensive with tariffs and limiting imports absolutely with tiny quotas.
On the subject of butter, in 2024, the UK imported 41,000 tonnes of butter worth £181 million from Ireland but only 4,000 tonnes worth £8.9 million from New Zealand. Yet the MPs in Westminster Hall are not worried about competition from Ireland.
7. Is the 52% statistic even correct?
Although ONS data shows that the UK still relied on the EU for 54% of its imports in 2024, using current price data, according to the ITC’s Trade Map, it doesn’t. The International Trade Centre (ITC) is a collaboration of the EU, the UN and the WTO. The ITC’s TradeMap database uses HMRC data since January 2020 and shows the proportion of UK imports from the EU as only 40% in 2024, down from 53% in 2018. As HMRC records imports in order to collect tariff payments, I suspect their data is more accurate than the ONS. Before Brexit, UK and EU trade data were collected by Intrastat surveys. These were less accurate, included a lot of double-counting and counted goods that were landed in large ports in Amsterdam, Rotterdam or Felixstowe as Dutch, Belgian or UK exports within the EU. Double-counting and miscounting of re-exported goods is one of the reasons UK trade with the UK appears to fall after Brexit, when it is just more accurate data.
The removal of reexports of tropical fruit and nuts imported from Commonwealth countries, landed in the UK and then distributed to other EU countries, is the main reason there have been lower Food and live animal exports to the EU. Fruit and vegetable exports to the EU fell by 25% between 2018 and 2024. I have written about this many times, I am surprised that so many MPs are unaware of this structural change in the data. UK EU dynamic SPS alignment will NOT change this. Tropical fruit will never be considered to be a UK export under the UK EU Trade and Cooperation Agreement (TCA). A veterinary agreement with the EU will NOT change this either.
8. ‘Brexit has led to our GDP growing 4% to 8% less than it would have between 2016 and 2024.’
This Brexit myth just will not go away, and has grown from 4% to 4% to 8%, and it has morphed from an average of possible outcomes predicted by ten economic groups years before Brexit to a definite outcome with verbs such as, ‘has led to’, ‘will be’ or ‘is’ used alternately in the claim above by various MPs. They don’t understand if it has happened, is happening now or will happen in the future, but apart from the timing, they are all sure that it is real.
However, the OBR’s guestimate of a potential 4% reduction in relative productivity over the long term was just the average of 13 econometric projections, made by 10 different economists, using different econometric models and assumptions. All of the projections were made before the UK and EU had agreed the TCA, and so the OBR should have asked the economists to re-run their calculations in 2020. But for some reason, they didn’t and have continued to refer to the average reduction in relative productivity of 4% in their Economic and Fiscal Outlook publications.
The original OBR report identified which of the 13 projections assumed a correlation between trade intensity and productivity because not all economists believe that this is true, especially for developed nations that have large internal markets and are less reliant on trade. If we go back to the 13 estimates and only average those that did not use this assumption, the average GDP reduction is only 2%, which is close to the margin of error. Margin of error is another thing that most people forget to mention when they repeat the average guestimate. But I won’t go into that now.
Econometric projections are not reality. They are educated guesses. The projections about Brexit’s effect on UK GDP ranged from -1.8% to -10%, which should tell you that this was dartboard stuff and should not be taken too seriously. Projections vary greatly by changing the assumption or the model. For example, the OBR’s average included two projections by the IMF using the same model but different assumptions, the results varied by 65%. Another think tank produced two projections using different models and different assumptions; one result was 2.56 times larger than the other. Econometrics is not an exact science. Averaging these projections doesn’t make them any more likely to occur.
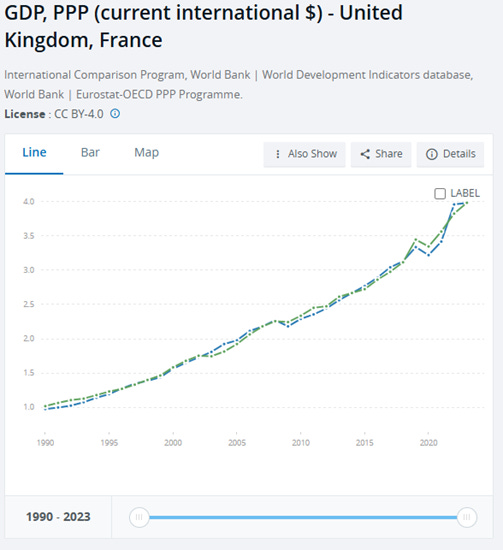
We are now halfway through the OBR’s long term, generally considered to be 15 years. World Bank data for GDP, in PPP (current international $), is shown in the graph below. You can see the UK (Blue line) and France (Green line) have had virtually identical GDPs. France overtook the UK in 2019, but the UK overtook France in 2022. In 2023, the two nations were back to identical GDPs. If Brexit was the cause of lower GDP in the UK, why is the UK and French GDP still in lockstep, just as they were before 2016? Fance is still in the EU. Why does anyone believe that UK GDP would have miraculously outperformed France if the UK had stayed in the EU? It is time for the OBR and the MPS, still promoting this myth, to admit that the projected average relative productivity reduction of 4% is unlikely to materialise.
9. ‘Our trade volume is 15% lower and long-term productivity is 4% lower’
This is another variation on the myth covered above. This also comes from the OBR Economic and Fiscal Outlook report, where they tried to justify the average projection of 4% lower productivity by claiming that it would be caused by 15% lower trade. The actual OBR quote is:
‘both exports and imports will be around 15 per cent lower in the long run than if the UK had remained in the EU. The size of this adjustment is calibrated to match the average estimate of a number of external studies that considered the impact of leaving the EU on the volume of UK-EU trade.’
Again, the OBR mentions that this is the ‘average estimate from a number of external studies’ but the MPs in Westminster Hall don’t seem to have read the full publication. So far, the trade data doesn’t support this estimate. From 2016 to 2024, UK total goods trade (imports plus exports) to the EU is up 28%, whether you include or exclude precious metals, and UK total service trade is up 72%, making total UK trade with the EU up 43%.

10. ‘Joining the EU’s ETS and its CBAM would help constituents’
Some of the Westminster Hall MPs thought that joining the EU’s emissions trading scheme (ETS) and its Carbon Border Adjustment Mechanism (CBAM) would help their constituents. They apparently don’t know that the UK has proposed its own CBAM but intends to protect UK industries, such as ceramics and glass, rather than EU ones. The EU’s CBAM doesn’t cover ceramics or glass, but it does cover electricity. Why would the UK abandon its ceramics and glass industries in order to align with the EU CBAM?
The UK imports electricity from the Continental EU, predominantly nuclear power from France, but it also exports electricity to Ireland. Would the EU seriously add a CBAM to Ireland’s imported electricity? Ireland has no alternative supplier other than the UK. But this won’t hurt UK electricity suppliers; they have a captive market in Ireland. Ireland will just have to pay up (to Brussels) or turn off.
11. ‘The UK is lagging behind our G7 peers’
Comparing goods exports between G7 countries is a silly idea, as the seven countries export different things, and there was a vast differential in exports between the G7 oil and gas exporters, the US and Canada, and the other G7 countries between 2018 and 2024. Also by only comparing Goods trade this claim excludes the UK’s large trade in services. Services make up a larger share of UK total exports than any other G7 country.
According to ITC data for total goods and services trade, the UK is not ‘lagging behind our G7 peers’. The UK has the fourth highest increase in total trade between 2018 and 2023 of the G7 countries, with 19% growth. US trade increased by 21% and Canadian trade by 26%. French total trade increased by 16% over the same period, and German trade by only 3%. (All measured in US dollars, current prices)

The UK could have had even higher export growth during this period if, like Canada and the US, it had chosen to export its natural resources: oil, gas, and coal, rather than close its coal mines and restrict new oil and gas fields in the North Sea. Aligning with the EU will not change the UK’s lack of commodity exports. If the UK wants to have the same export growth as the US and Canada, it needs to become a hydrocarbon exporter, not an importer.
12. ‘UK exports to the EU were 5% lower than they were in 2018’
This is another statistic that seems to have been grabbed out of nowhere. ONS data states UK goods exports to the EU were unchanged between 2018 and 2024 in current prices, but down 20% using CVM to account for inflation. Trade map data states that UK exports to the EU fell by 3%. However, in all cases, these statistics do not account for the change in products counted as UK exports between 2018 and 2024 due to the Rules of Origin in the TCA. They have also not considered the fall in UK exports due to UK environmental policies, particularly the excessive taxes on oil and gas producers and the UK’s very high industrial energy prices that have made many UK goods uncompetitive in international markets.
The largest falls in UK exports to the EU, using ONS data, are in consumer office machinery, footwear, plumbing and lighting fixtures and clothing. All of these exports are lower because these goods are not made in the UK, or not enough of their value is made in the UK to meet the requirements of the rules of origin in the UK-EU TCA. So they are no longer counted as UK exports to the EU. Closer alignment with the EU will not change this.
Another export fall was in products that successive UK governments are actively suppressing, most notably oil and oil derivative products, such as chemicals and plastics. Closer alignment with the EU will not change this either. A change in the UK’s environmental policy and a reduction in the excessive taxes on the oil industry would help, but the EU started most of this environmental zealotry, so I doubt aligning with their regulations would increase UK trade.
13. ‘Smaller firms are seeing the biggest fall in trade’
Oh no, they aren’t. MPs who are clearly at this debate for ideological reasons always try to pretend that they are there to help the little guy. Unfortunately for them, the ONS keeps trade statistics by company size and by industry. This data isn’t divided by exports to EU or non-EU countries, but if small company exports of, for example, fabricated metal products are up by 32%, does it matter where those exports are going? Obviously, small companies will find the additional administration eats into their profits more than a large company, but ONS figures do not show a general drop in trade other than in the industries whose products are now outside the Rules of Origin in the TCA, such as clothing and footwear. It is most likely that companies manufacturing in Asia and exporting to the EU will do so via a UK freeport or bonded warehouse, and so the goods are no longer included in UK trade statistics, but the company will still be profiting from the sales in the EU.
14. ‘Red tape has hit our economy to the tune of £100 billion’
Embarrassingly, this bit of hyperbole came from my own MP, Joe Powell. Powell should know that UK goods exports to the EU in 2024 were £174 billion and UK goods imports from the EU were £314 billion. Red tape equal to 20% of total goods trade seems a bit rich. I have no idea where this £100 billion cost figure came from, Powell didn’t give a citation.
15. ‘17,000 firms have stopped trading with the EU’, and’ 20,000 small businesses have simply stopped exporting to the EU’
Stella Creasy claimed that 17,000 businesses have stopped trading with Europe, while Clive Jones raised her with: ‘20,000 small businesses had stopped exporting to the EU’. Stella and Clive should know that there are 5.43 million businesses registered in the UK. I wonder if these MPs know if the companies have stopped trading with the EU because they have gone out of business, or whether they have stopped trading with the EU because it wasn’t profitable enough. Businesses make these decisions all the time. Trading with the EU is not necessary for running a successful business. Unfortunately, very few UK MPS have ever run a business.
Also, very few UK MPs seem to know that the ONS keeps trade data on UK businesses by size. Since 2016, the number of domestically owned micro businesses exporting goods has grown from 7,400 in 2016 to 11,400 in 2022. The number of domestically owned small businesses exporting goods has increased from 8,600 to 11,200, and the number of medium-sized domestically owned businesses exporting goods has increased from 4,700 to 5,400. Even the number of UK-owned large businesses exporting goods has increased from 1,400 to 1,500. These are the latest figures available, and the ONS only counts businesses that exported more than £250,000. But I can’t see the 17,000 or 20,000 businesses that have supposedly stopped trading in the ONS chart below. Can you?

16. British sausages are banned in the EU. And other dubious claims.
But the wildest claim in the Westminster Hall debate came from the MP for Lewes, James MacCleary: ‘British sausages, which were once sold freely from Paris to Berlin, are now banned outright.’
All of these MPs seem to live in a data-free universe and imagine or hope that everyone else does as well. James MacCleary can rest easy. In 2024, the UK exported 4,700 tonnes of HS 1601 sausages to the EU. The two largest EU markets for UK sausages are Spain (2,300 tonnes in 2024, up from 1,960 tonnes in 2018) and Ireland (1,200 tonnes in 2024, down from 2,330 tonnes in 2018). France is the UK’s third-largest market and bought 296 tonnes of sausages in 2024, up from 184 in 2018. Germany has never been a big market for UK sausages, but still bought almost twice as much in 2024, 62 tonnes, as it did in 2018, 34 tonnes.
MacCleary may be confused with the UK’s recent ban on imported meat from EU countries to prevent foot and mouth disease from entering the UK. There have been recent outbreaks of foot and mouth disease in Germany, Hungary, and Slovakia.
MacCleary also claimed that British exports remained 11% below their 2019 level, which isn’t true either; UK goods exports were up 2% between 2019 and 2024 according to the ONS and down 2% according to ITC. Total exports, including services, were up 25% between 2019 and 2024 (ONS figures for goods and services). He also claimed that 4 out of every 10 British products once stocked on EU shelves have now vanished. Again, there is no citation, and as his other claims are false, I am guessing that this one is, too.
Conclusion
During the 47 years the UK was a member of the EU, all UK trade was determined in Brussels. Trade is an EU competency. So we shouldn’t be surprised that UK MPS don’t understand trade or trade figures. However, they need to get better at scrutinising information and finding better source material. Hopefully, they will check their figures before the next debate.
Unfortunately, none of the MPs in Westminster Hall seemed to appreciate the irony that such a debate was only possible because of Brexit. They all remembered to thank the MP who secured the debate, but they should have been thanking the 17.2 million people who voted to leave the EU, for they were the ones who really made the debate possible.